Quality Control Monitoring of Incubators
There is no common generally accepted way to compare incubator performance. Our lab uses 8 Miri incubators. Each incubator has 6 individual sub-incubators. That way when a cohort of embryos is removed the gas composition of the other chambers in that incubator is not affected.
We can look at a sample of 318 cohorts of embryos from 5,784 oocytes that were in culture from oocyte retrievals from 9/1/2024 through 3/4/2025. The specific metric we use is the summed number of day 5 blastocyst equivalents produced divided by the number of oocytes obtained. We use the same denominator for ICSI and conventional insemination cycles. There is no apparent difference in incubator performance.
On average we see about 0.19 day 5 blastocyst equivalents per oocyte. Our clinic does 69% ICSI and 31% conventional insemination. For the ICSI cycles there are an average of 0.18 day 5 blastocyst equivalents per oocyte and for conventional insemination cycles 0.22 day 5 blastocyst equivalents per oocyte.

We also want to look at the sub-incubator performance (the individual drawers). We label these 1 through 6 so that the first incubator “A” has sub-incubators of A1, A2, A3, A4, A5, and A6. Some of the sub-incubators get used more than others so we want to graph the number of cohorts of embryos for a given sub-incubator on the x-axis and the average day 5 blastocyst equivalents on the y-axis.
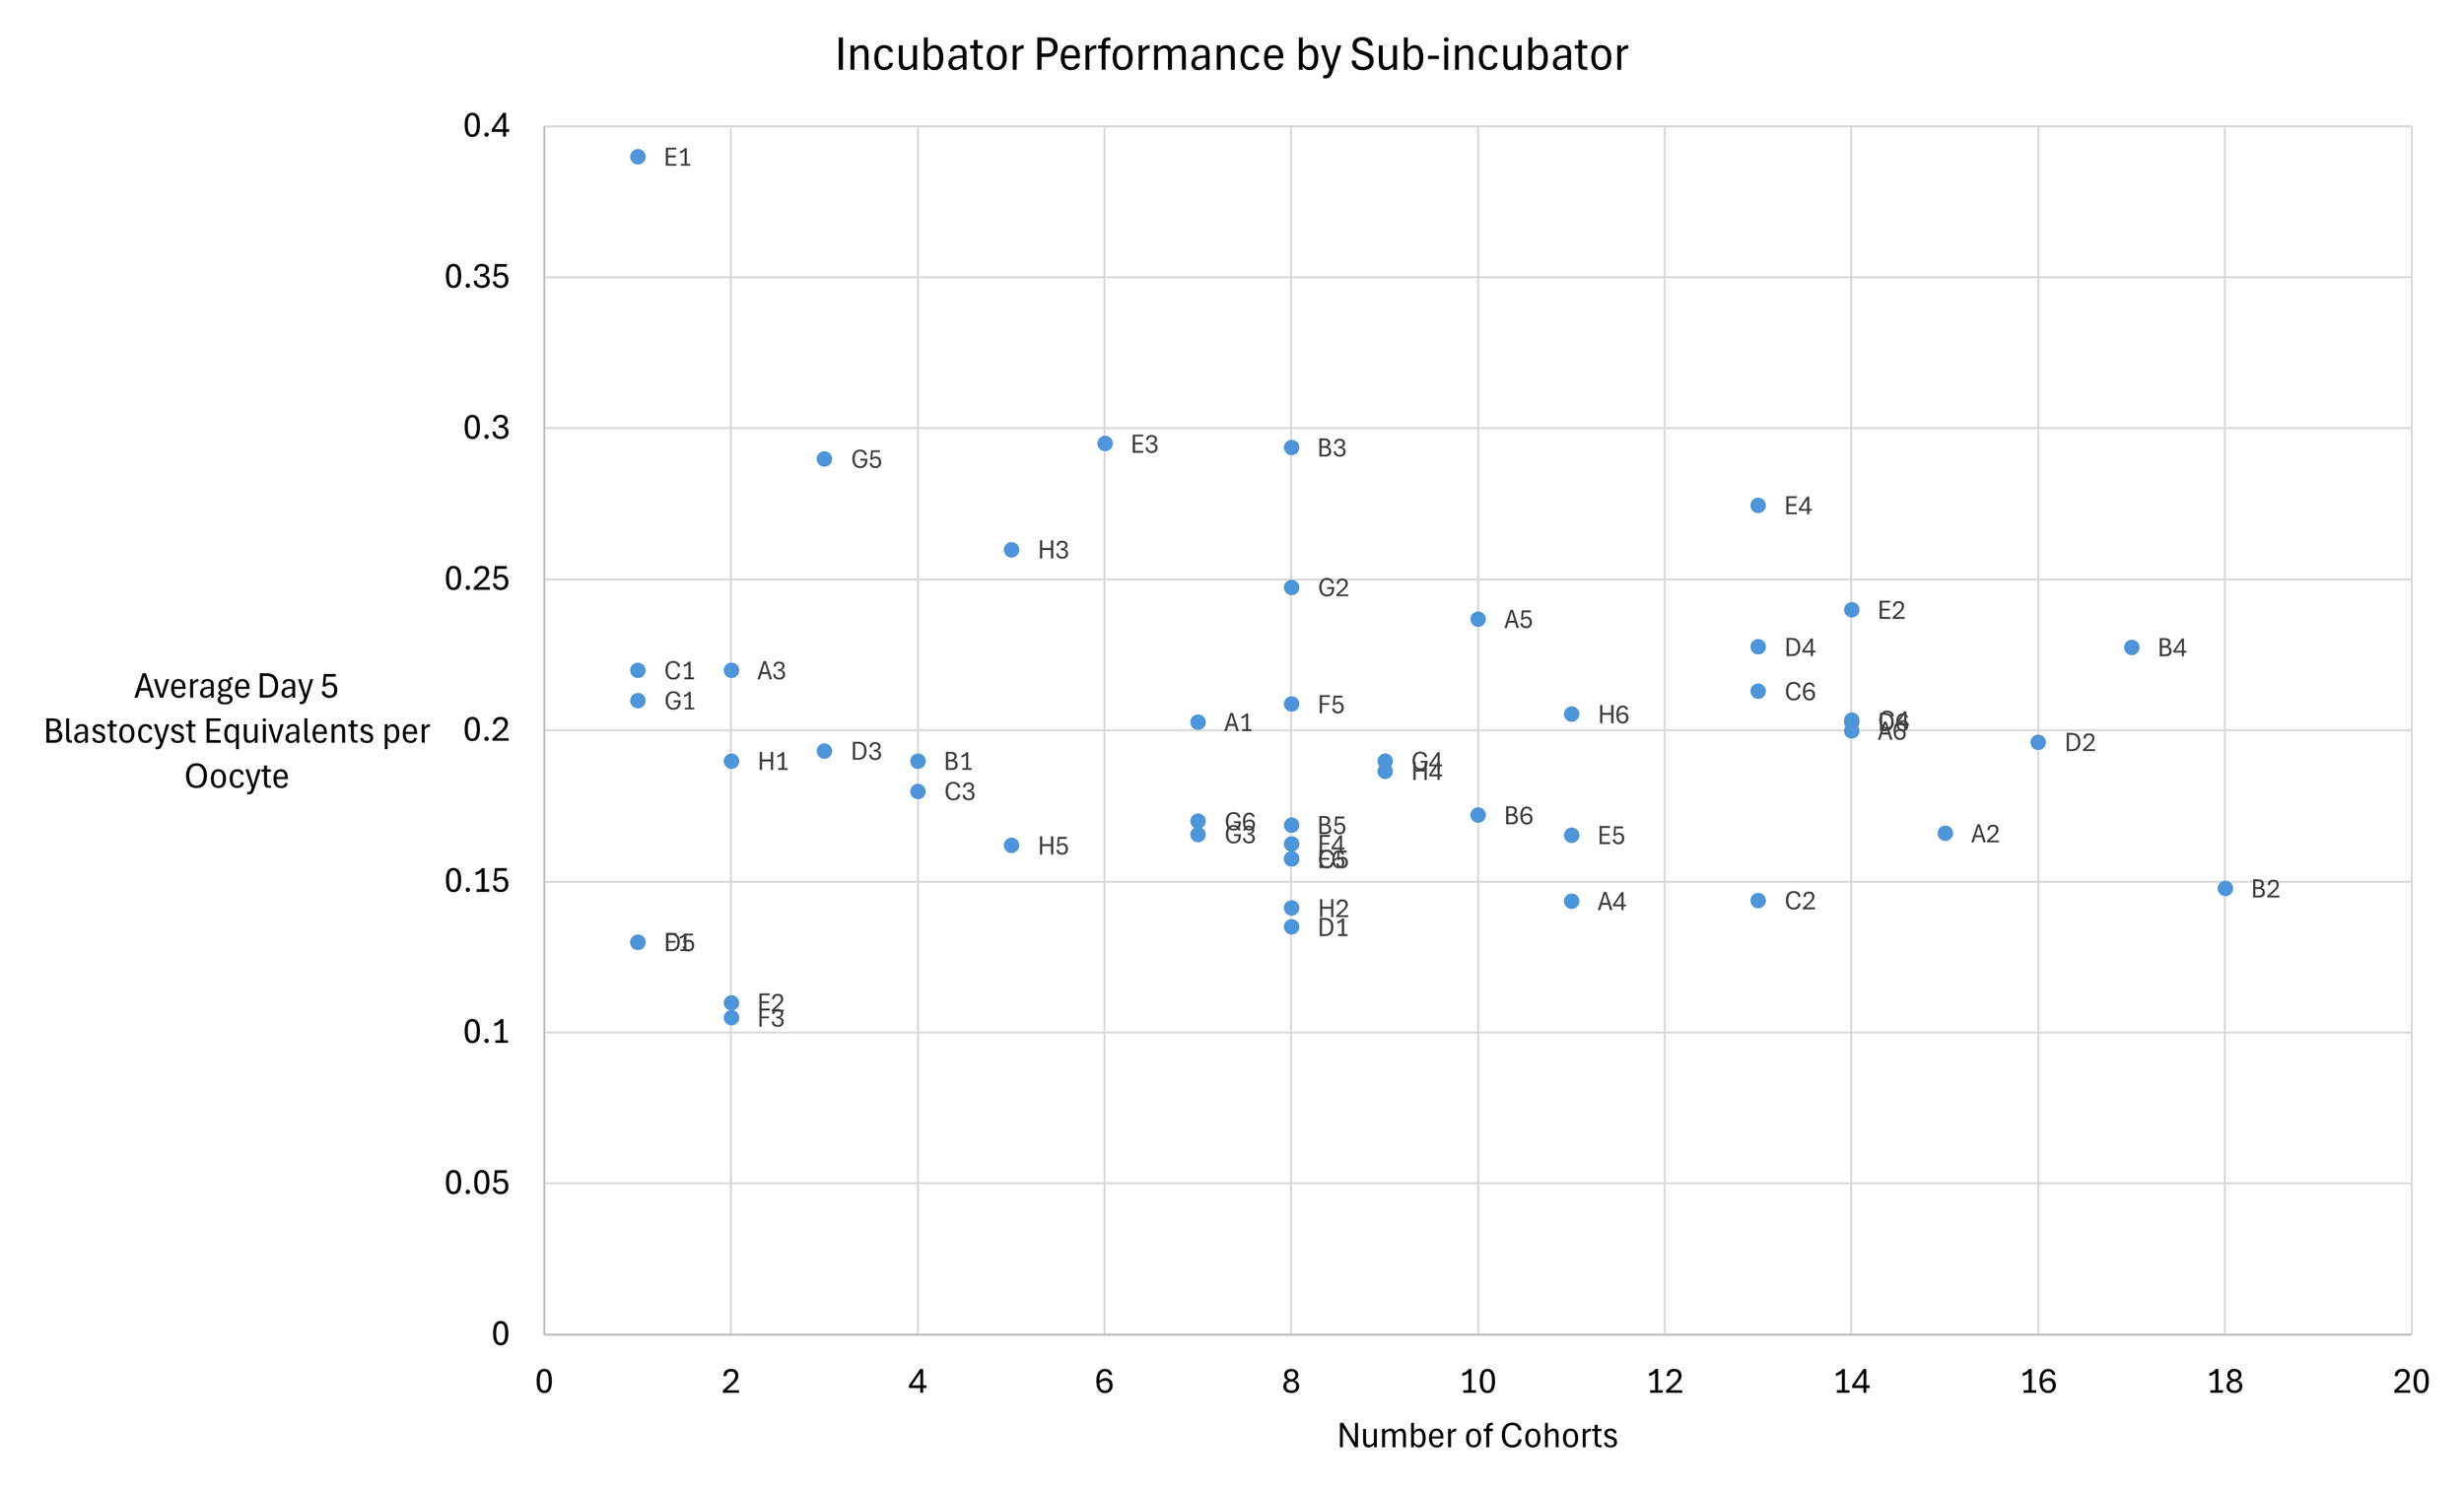
We can graph these points on a Q-Q plot and we see there are no underperforming outliers but there are about 6 overperforming incubators which is unexpected. One of these is E1 which only had 1 cohort and the others are G5, H3, E3, B3, and E4. There is no clear pattern seen so likely this is random variation mostly from incubators that had lower numbers of embryo cohorts in the sample dataset.
